Fluorescent imaging is a powerful technique for visualizing and understanding biological processes. Traditionally, these images are captured using high-cost microscopes that image one sample at a time. However, advancements in imaging technology have introduced slide scanners, which allow users to image multiple samples in a single session with minimal user input, enabling more efficient project scaling.
A key question remains: Can results obtained from a traditional wide-field microscope be reliably replicated using a slide scanner?
To address this, a collaboration was formed with Translucence Biosystems, a company specializing in 2D and 3D histology analysis of biological samples. As part of a pilot experiment, images were acquired using two different imaging systems — the wide-field microscope and the InnoQuant slide scanner. Translucence Biosystems then analyzed the images to assess the reproducibility of results and overall image quality.
The goal of the experiment is to evaluate the inflammatory effects of LPS (lipopolysaccharide) administration in mice, specifically by examining microglial activation in LPS-treated brain sections compared to PBS-treated controls. Previous studies suggest that LPS induces
cognitive impairment and neuroinflammation, with microglial activation serving as a key marker of this process. By analyzing Iba1 (a microglial marker) signal between PBS- and LPS-treated groups, we aim to confirm this effect.
To achieve this, Iba1 signal was captured using both imaging systems, and the same analysis was applied across all images. Our findings confirm a consistent LPS-induced inflammatory response across both imaging platforms. Additionally, the InnoQuant slide scanner demonstrated reliable and reproducible results, with the added advantage of scalability, making it a valuable tool for large-scale imaging studies.
Description of the technologies
The wide-field microscope uses an LED light source, and a CMOs camera as a detector. The final image is a merge of numerous field-of-view acquisitions.
InnoQuant uses laser-light sources and PMT as detectors. The lasers scan the sample line by line and the final image is obtained avoiding post-processing steps, as no field-of-view are created.
Image acquisition
The brain sections were stained as follows: GFAP (375 nm) – CD68 (488nm) – Iba1 (555 nm) – Specific human marker (640 nm). The samples were imaged with InnoQuant and with a wide-field microscope.
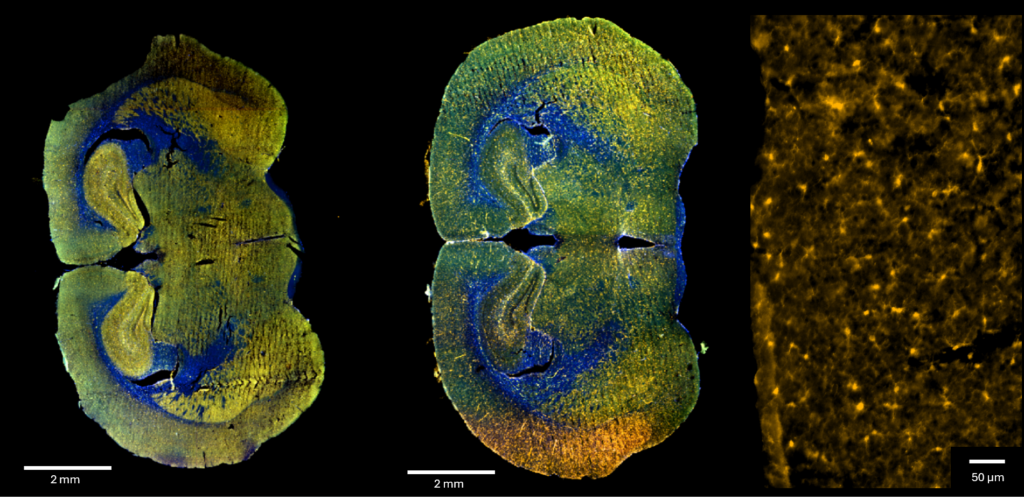
Figure 1: Full mice brain samples obtained with InnoQuant. A. PBS-treated sample B. LPS-treated brain sample C. Iba1 signal highlighting microglia
PBS vs LPS intensity profile
Intensity profile of the control and the LPS-treated samples were plotted using ImageJ.
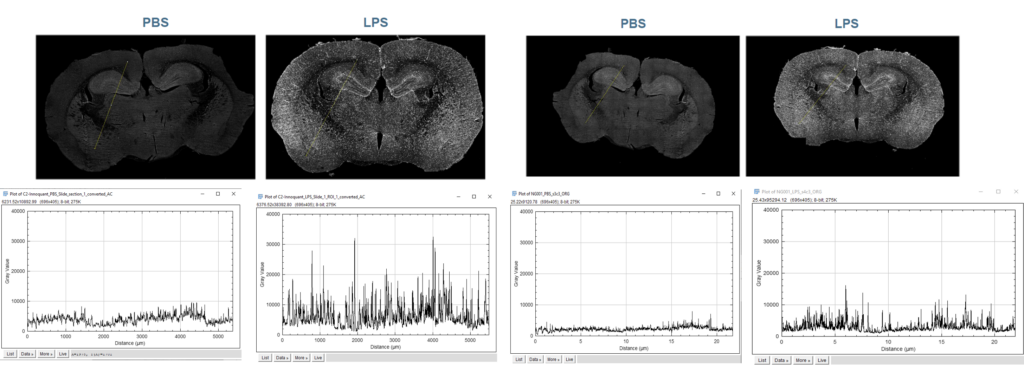
Figure 2: intensity profiles of a full brain, for PBS and LPS treated brain samples, on InnoQuant and a wide-field microscope.
LPS-treated samples have a higher signal than PBS-treated slides. Microglial activity seems enhanced. Graphs have the same appearance regardless of the system. More grey values are available with InnoQuant, leading to a higher signal overall, and, it seems, a better Signal/Background ratio. The Signal/Background ratio needs to be calculated for a more reliable result.
InnoQuant: a better signal/background ratio compared to the wide-field acquisition
Two ROIs were selected in the hippocampus for PBS and LPS, using InnoQuant and wide-field images. Ten cells were randomly selected within the same anatomical region from each treatment group to compare differences in signal intensity and distribution across treatments.
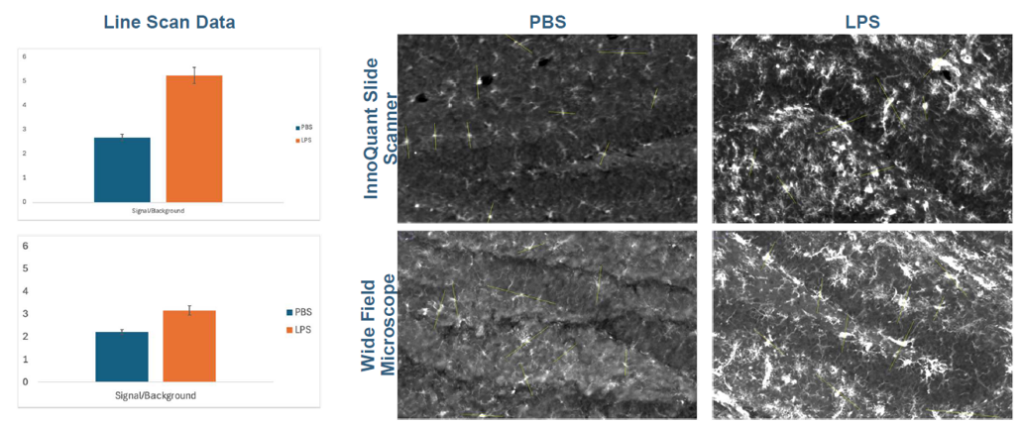
Figure 3: signal/background comparison between InnoQuant and a widefield microscope, for PBS and LPs-treated samples.
Preliminary line scan analysis suggests a notable difference in signal-to-background ratio between PBS and LPS-treated groups in images produced by the InnoQuant slide scanner. This observation indicates the potential for improved assay performance using the InnoQuant system. However, additional analysis is necessary.
Determining the total area of microglia (Iba1 signal) using an ImageJ threshold
The surface of the Iba1 signal (microglia) was analyzed using a signal threshold in ImageJ. The method used is described as follow:
- Samples:
The same 8 slices (4 PBS, 4 LPS) were imaged using two different imaging systems and quantified independently.
- Image Preprocessing:
ImageJ’s rolling ball background subtraction was applied to whole-brain images to reduce background noise and enhance Iba1 signal clarity.
- Threshold Determination:
A blinded rater selected a reliable signal threshold for Iba1 detection from a subset of preprocessed images

Figure 4: Surface of the Iba1 (microglial) signal for PBS and LPS-treated mice groups, from InnoQuant and wide-field images.
- Signal Quantification:
All sections were manually processed in ImageJ at the determined threshold, quantifying the Iba1 signal by measuring the total area of expression above the threshold.
- Statistical Analysis:
Data were normalized to their respective PBS controls to enable comparisons between systems. Two-tailed unpaired Student’s t-tests were then performed using Prism (v. 10.1.0; GraphPad).
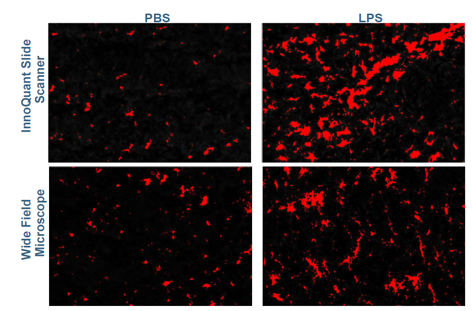
Figure 5: Surface of the Iba1 (microglial) threshold for images from InnoQuant and wide-fiel
The per-sample analysis reveals that the threshold determined for each imaging system performs comparably, as indicated by the similar trends observed for each sample across the two systems. This consistency demonstrates reliable signal detection across both imaging platforms.
Microglial total area is enhanced on all LPS-treated samples. This suggests a high activation of microglial activity in these samples, a result of neuroinflammation.
Statistical analysis of the results
- Unpaired student t-tests comparing PBS vs LPS treatments were performed respectively on the group of data from InnoQuant and the group of data from the wide-field microscope.
- These tests assess whether there is a significant difference in Iba1 expression between the PBS and LPS treatment groups within each imaging method.
- The p-value being <0.5 in each group, the statistical analysis confirmed that LPS induces a neuroinflam- matory response compared to PBS. This significance was replicated using both imaging methods.
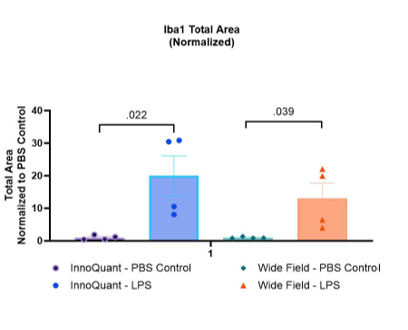
Figure 6: Mean Iba1 surface area for each group on InnoQuant and wide-field images.
Conclusion
The results showed an enhanced Iba1 (microglial) signal in the LPS-treated group. This confirms that LPS induces neuroinflammation.
These results were obtained with images from InnoQuant and a wide-field microscope. Both systems give reliable and comparable results. However, the images from Innoquant have a better Signal/Background ratio, and a higher number of grey value in the results, which lead to a more reliable quantification.
Do you want to learn more about InnoQuant and its user-friendly automated workfiow?
Why is InnoQuant particularly well-suited for this analysis ?
-
- The 4 fluorescent channels are acquired simultaneously.
- The entire brain section can be captured at 0,5 µm/pixel in 15min.
- A single image of the whole sample is generated at once in a sole field of view. 98% uniformity on the full slide and pixel-by-pixel rigorously identical detection.
- Pixel intensity values originate exclusively from raw fluorescence signals and are not biased by stitching or shading artifacts.
Do you want to discover how Translucence can help you with your image analysis?
Precision Imaging Meets AI-Powered Quantification with Translucence Biosystems
Translucence Biosystems specializes in AI-driven quantification of biological samples, providing high-throughput analysis and advanced image processing.
-
- High-Throughput AI Quantification – Scalable, automated sample analysis.
- 3D Regional Analysis – Mapping and quantification aligned with anatomical atlases.
- Automated Colocalization Metrics – Precise identification of overlapping signals.
- Comprehensive Object Quantification – Measure intensity, density, size, and shape.
For more information
WWW.TRANSLUCENCEBIO.COM
References
Schindelin, J., Arganda-Carreras, I., Frise, E., et al., Fiji: an open-source platform for biological-image analysis, Nature Methods, 9(7), 676-682, 2012
Ye, X., Zhu, M., Che, X. et al. Lipopolysaccharide induces neuroinflammation in microglia by activating the mTOR pathway and downregulating Vps34 to inhibit autophagosome formation. J Neuroinflammation 17, 18 (2020). https://doi.org/10.1186/s12974-019-1644-8