Checking immunofluorescence staining specificity with InnoQuant scanner for studying the display of sialic acid in large ferret lung tissue sections
Robert P. de Vries(1), María Ríos Carrasco(1), Perrine Borel(2), Charline Baraban(2)
(1)Department of Chemical Biology and Drug Discovery, Utrecht Institute for Pharmaceutical Sciences, Netherlands (2)Innopsys, Carbonne, France
Goal: investigate the display of α2,3 and α2,6 bonds in sialic acid expressed in ferret epithelial cells over entire tissue sections in less than 10 minutes using InnoQuant scanner
Background
Sialic acids are the terminal fragments of complex glycans and are known to play an important roles in many biological processes. They are also receptors for many viruses. Influenza viruses are known to bind to the host cells using hemagglutinin (HA) glycoproteins on their surface. HA interacts with various sialylated glycans in lung tissues and human and avian viruses prefer either α2,6 and α2,3 respectively.
The aim of this study is to explore the distribution of sialic acid linkage in lung tissue of ferrets as these are the main animal model for human influenza viruses.
Avian hosts contain glycans terminated by α2–3-linked sialic acids (or avian-type) on their surface, while human upper respiratory tissues display α2–6-linked sialic acids (or human-type). The expression of sialic acids in host cells therefore drives influenza A virus to be specific for either avian or human-type receptors.
Studying the expression of sialic acid in lung tissue of other species is essential to understand the zoonotic abilities of influenza viruses.
To study the display of sialic acid in ferret lung tissue, different stainings have been developed by the Department of Chemical Biology and Drug Discovery of Utrecht Institute for Pharmaceutical Sciences. Using InnoQuant, a fluorescent whole-slide scanner, the entire sections of immunolabeled lung samples have been scanned, resulting in high-quality, artifact-free images suitable for reliable analyses of the validity of staining and for studying molecular complexes of interest.
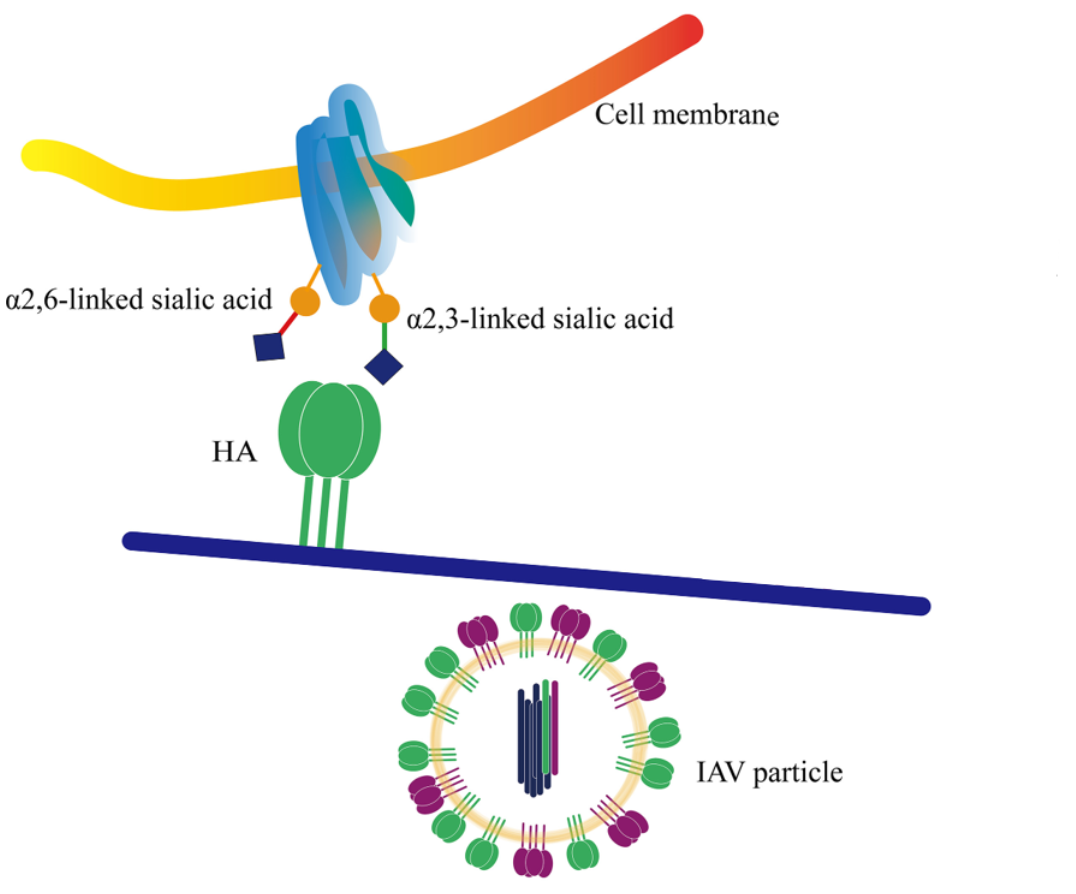
Figure 1: Binding principle between the influenza virus and the host cell. Wang F. et all, 2021.
Fluorescent probes used to tag molecular complexes in ferret lung tissue
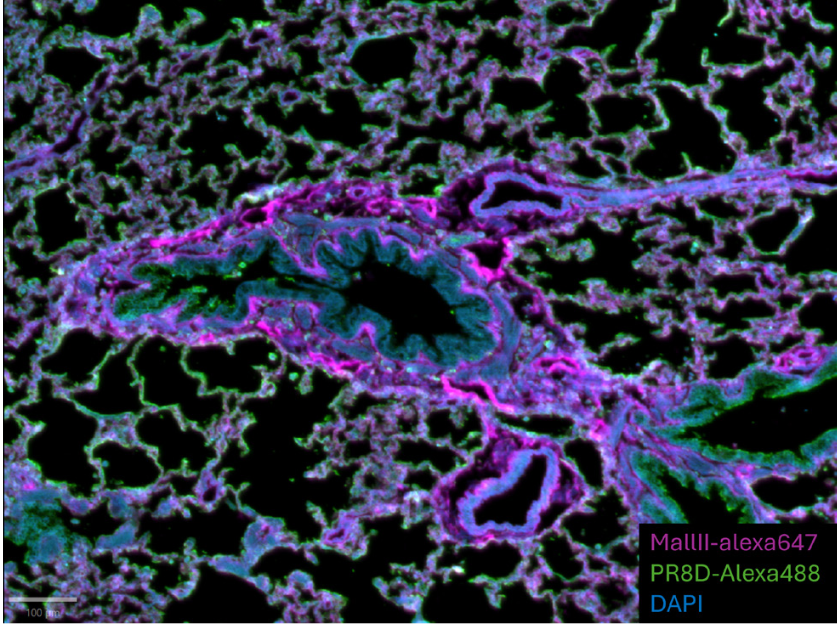
Figure 2: Region of interest of a ferret lung tissue section. Stainings are detailed in this document. Acquisition with InnoQuant. Sample courtesy of Robert de Vries and María Ríos Carrasco, Utrecht Institute for Pharmaceutical Sciences
PR8D+human Strep mAb+α-human alexa-488
PR8D hemagglutinin (HA) is a recombinant protein derived from (A/Puerto Rico/8/1934(H1N1)), a human strain known to bind to α2,6–linked sialic acid on the surface of target cells. To increase multivalency, this protein was precomplexed with an α-Streptag antibody, followed by a mouse α-human antibody conjugated with Alexa-488 dye.
MAL II +streptavidin Alexa-647
MAL II (Maackia amurensis lectin II) is a biotinylated lectin from Vector Laboratories that binds to carbohydrate structures containing α2,3-linked sialic acid. MAL II was precomplexed to streptavidin conjugated with Alexa 647. Biotin/streptavidin interactions were used to enhance signal due to weak binding interactions.
Imaging 1cm2 3-plex IF stained lung sections in less than 10 min using InnoQuant
Step 1 - Checking the absence of signal without the specific ligand (controls)
– Control with PBS without any dyes
– Control with streptavidin-alexa-647 without MAL II
– Control with human strep mAb+α-human alexa-488 without PR8DHA
The absence of specific signal in the 488 and 647 channels proves the need to use the dyes with specific proteins that will bind to sialic acid receptors. The signal in the 488 channel is not specific (no distinction between the DAPI signal and the 488 signal) and corresponds to autofluoresence. The parameters of InnoQuant have been optimized to reduce autofluorescence in the next acquisitions, by modifiyng the laser power and PMT gain settings.
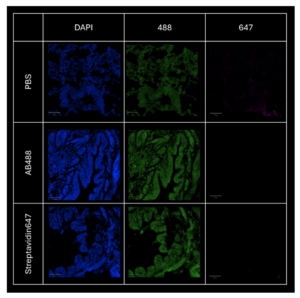
Figure 3: comparison of the signals in the absence of specific binding proteins. The signal acquired corresponds to autofluorescence. Scale bar: 100 μm.
Step 2 - Checking the signal with the specific ligand
Each tissue has been respectively stained with the precomplexed proteins/lectins. The goal was to look for specific signal highlighting the presence of sialic acid.
For the PR8D-AF488 staining, the absence of signal in the 647 channel is coherent given the lack of fluorophore. Despite some light autofluorescence of the tissue in the 488 channel, a distinct signal is still visible and detectable, proving the efficiency of the dye to bind specific glycan structures on the cells tissue. The specificity of the 488 signal is visible on the composite image.
For the MAL II-AF647 staining, there is a very light autofluorescence in the 488 channel. This signal is not specific and matches the DAPI signal. The 647 signal is unique and highlights new structures on the sample.
This step proves that both precomplexed proteins do not overlap and are detectable in their specific channel.
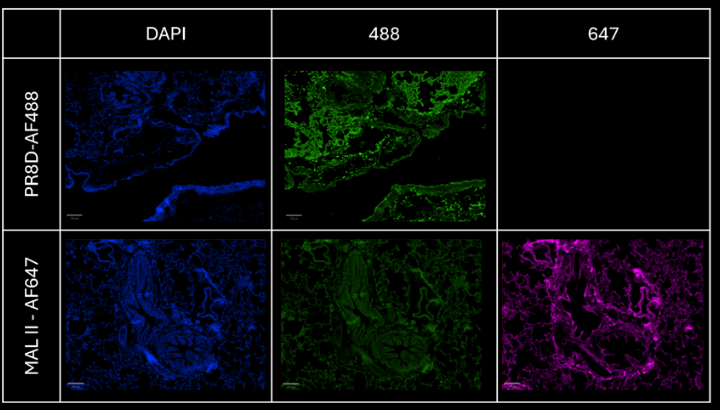
Figure 4: comparison of the signal on each channel for PR8D-AF488 and MAL II-AF647 stainings respectively.
Scale bar: 100 μm.
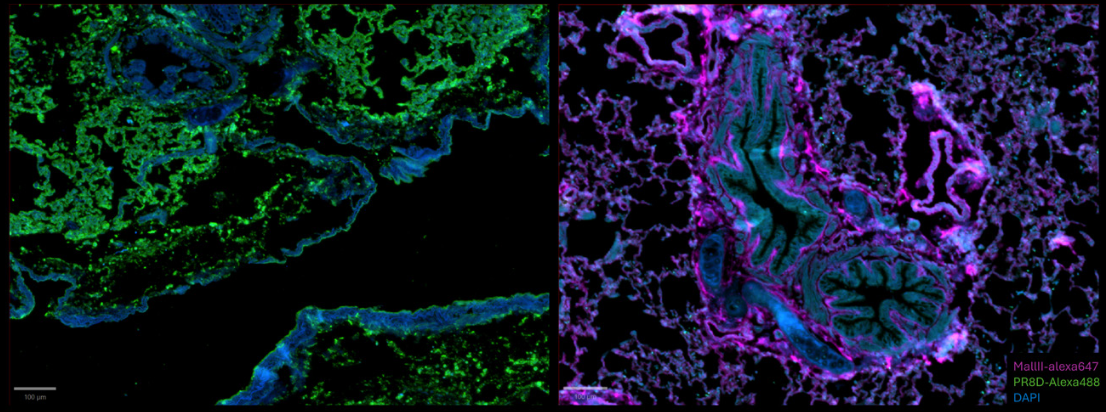
Figure 5: composite images for PR8D-AF488 and MAL II-AF647 stainings respectively.
Scale bar: 100 μm.
Step 3 - Checking the signal obtained from sequential stainings
Two sequential stainings have been performed:
– With PR8D-AF488 first and MAL II-AF647 in a second step
– With MAL II-AF647 first and PR8D-AF488 in a second step
Performing a sequential staining is a key process to check the specificity of a protein, conjugated to a particular dye. If the first protein complex added was not specific to a sialic acid structure, the second protein complex would not be able to bind its own structure because all sites would be saturated.
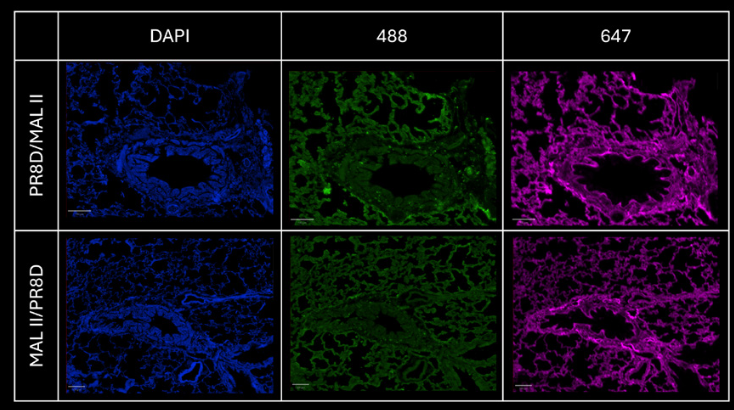
Figure 4: comparison of the signal on each channel for PR8D-AF488 and MAL II-AF647 stainings respectively.
Scale bar: 100 μm.
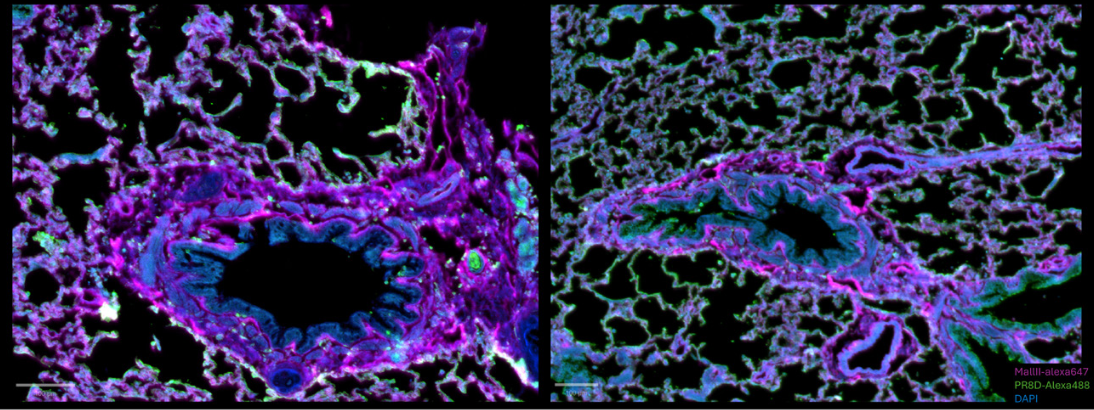
Figure 5: composite images for PR8D-AF488 and MAL II-AF647 stainings respectively.
Scale bar: 100 μm.
In both situations, there is still a light autofluorescence signal in the 488 channel. However, the composite view helps to understand that there is still a specific 488 signal. In each case, there is a distinct signal proving that the precomplexed proteins are specific to their own structure. These images highlight the presence of both (α2,3) and (α2,6) sialic acid in ferret lung tissue.
To better understand their distribution, we calculated the surface ratio of both signals using ImageJ Fiji.
Identify the dominant type of sialic acid calculating the signal surface
A short image analysis workflow was performed using ImageJ for both sequential stainings.
The same workflow (without the first step) was applied to the composite image to further calculate a surface ratio.
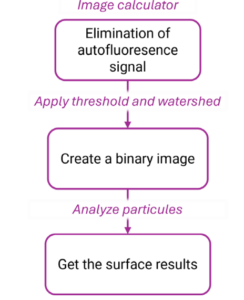
Figure 8: image analysis workflow in Fiji. The name of the functions used are displayed in pink.
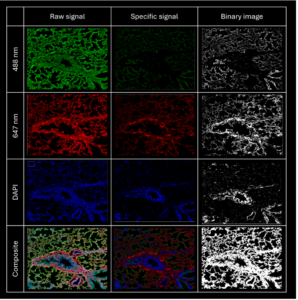
Figure 9: image analysis results for the MAL II-AF647 / PR8D- AF488 sequential staining. Image surface: 1169256 μm2
Values obtained
Table1: Results of the surface value of each signal for the two types of sequential stainings in μm2.
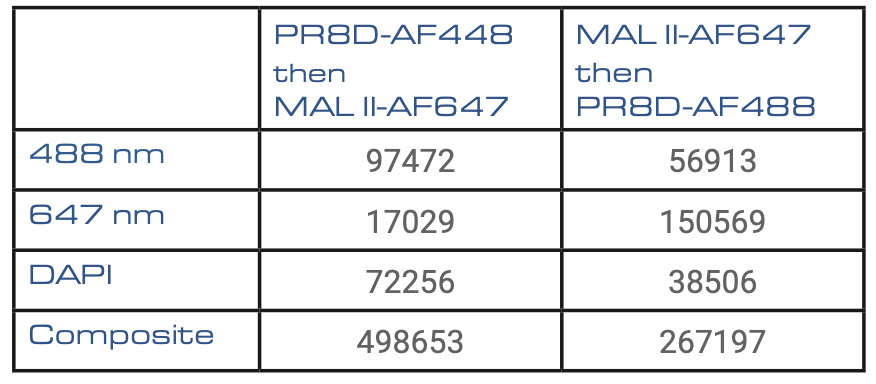
Table2: Calculation of the surface ratio of each signal on the composite signal.
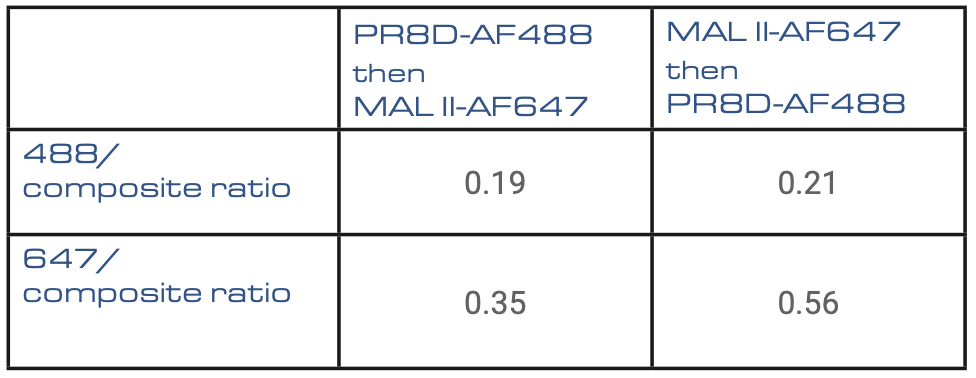
The ratios indicate a predominance of the 647 signal, corresponding to the MAL II +streptavidin Alexa-647 dyes. These results demonstrate that α2,3 linked sialic is a dominant species in the ferret lung.
Conclusion
Molecular complexes custom-labelled with fluorescent probes enable the monitoring of specific binding and are of great help to verify staining validity. The identification of each specific sialic acid signal and the analysis of their surface ratio have been carried out using whole tissue images combined with image analysis protocol using an open- source analysis software. In this case-study, we demonstrate that whole-slide images from InnoQuant enables the generation of relevant data in a third-part analysis software. The image quality allows measurements such as signal
surface to better understand the distribution of specific sialic acid structures on a tissue.
Why is InnoQuant particularly well-suited for this analysis ?
- The 3 fluorescent channels are acquired simultaneously
- The entire ferret lung section (approx. 1 cm2) can be captured at 0,5 μm/pixel in less than 10 min.
- A single image of the whole histological sample is generated at once in a sole field of view. Perfect field uniformity and pixel-by-pixel rigorously identical detection.
- Pixel intensity values originate exclusively from raw fluorescence emitted signals and are not biased by stitching or shading processing.

References
Bankhead, P. et al. QuPath: Open source software for digital pathology image analysis. Scientific Reports (2017). https://doi.org/10.1038/s41598-017-17204-5
Jack Cheeseman, Gunter Kuhnle, Daniel I.R. Spencer, Helen M.I. Osborn, Assays for the identification and quantification of sialic acids: Challenges, opportunities and future perspectives, Bioorganic & Medicinal Chemistry, Volume 30, 115882, ISSN 0968-0896, (2021) https://doi.org/10.1016/j.bmc.2020.115882.
Nikoloz Nemanichvili, Ilhan Tomris, Hannah L. Turner, Robert P. de Vries et al. Fluorescent Trimeric Hemagglutinins Reveal Multivalent Receptor Binding Properties, Journal of Molecular Biology, Volume 431, Issue 4, 842-856, ISSN 0022-2836 (2019), https://doi.org/10.1016/j.jmb.2018.12.014.
Schindelin, J., Arganda-Carreras, I., Frise, E. et al. Fiji: an open-source platform for biological-image analysis. Nat Methods 9, 676–682 (2012). https://doi.org/10.1038/nmeth.2019
Sieben C, Sezgin E, Eggeling C, Manley S. Influenza A viruses use multivalent sialic acid clusters for cell binding and receptor activation. PLoS Pathog. 8;16(7):e1008656. (2020) https://doi.org/10.1371/journal.ppat.1008656
Wang F,Wan Z,Wang Y,Wu J,Fu H,Gao W,Shao H,,Qian K,,Ye J, Qin A,, 2021. Identification of Hemagglutinin Mutations Caused by Neuraminidase Antibody Pressure. Microbiol Spectr 9:e01439-21. https://doi.org/10.1128/spectrum.01439-21